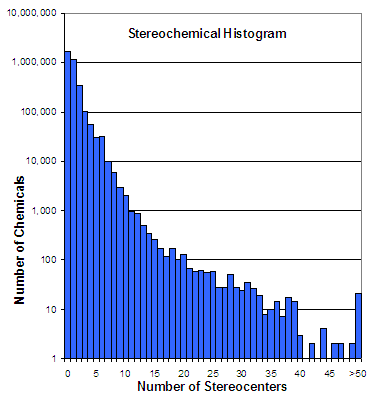
Histogram of number of stereocenters per chemical in ChemDB on a log scale. The fraction of compounds with at most 16 isomers (4 stereocenters) is 97.5%. All entries with 50 or more stereocenters are binned at 50.
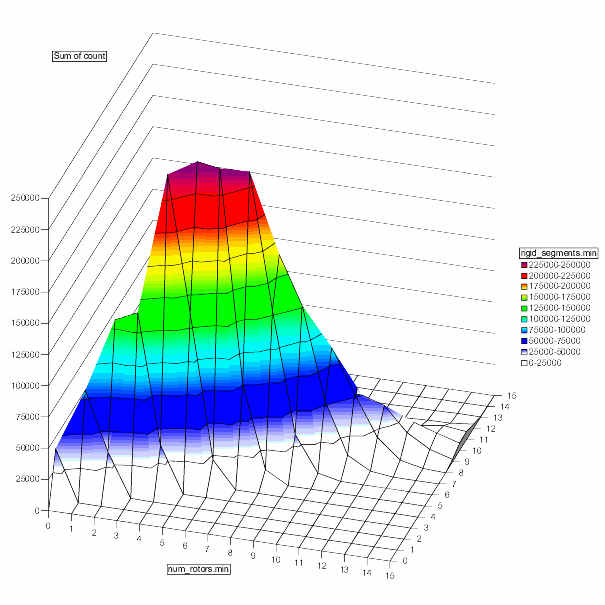
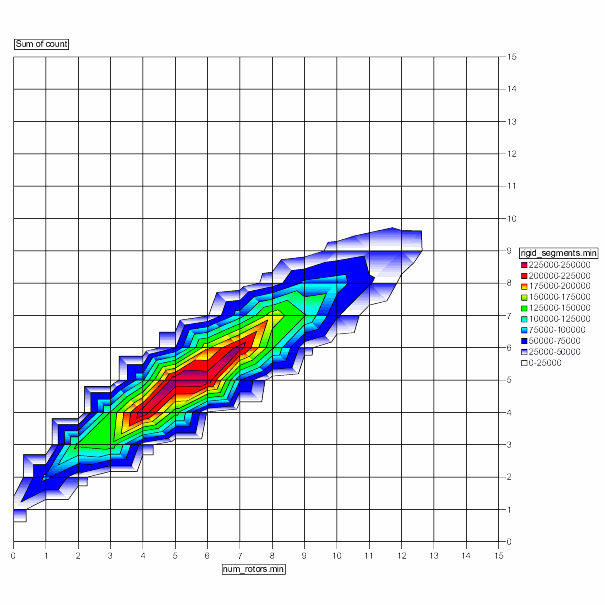
Two-dimensional histogram of the chemicals with respect to the number of rotatable bonds and rigid segments in each. The diagonal and "thin" arrangement of the combined distribution indicates that these two properties exhibit a strong positive correlation. Of course, this is to be expected since rigid segments are specifically defined here as the number of segments delimited by rotatable bonds.
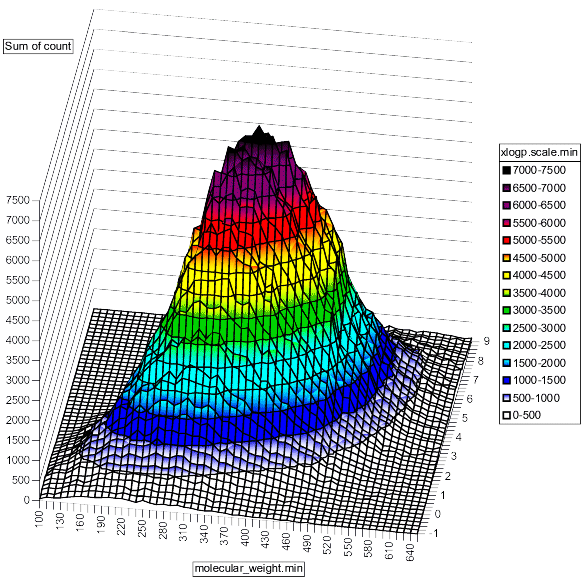
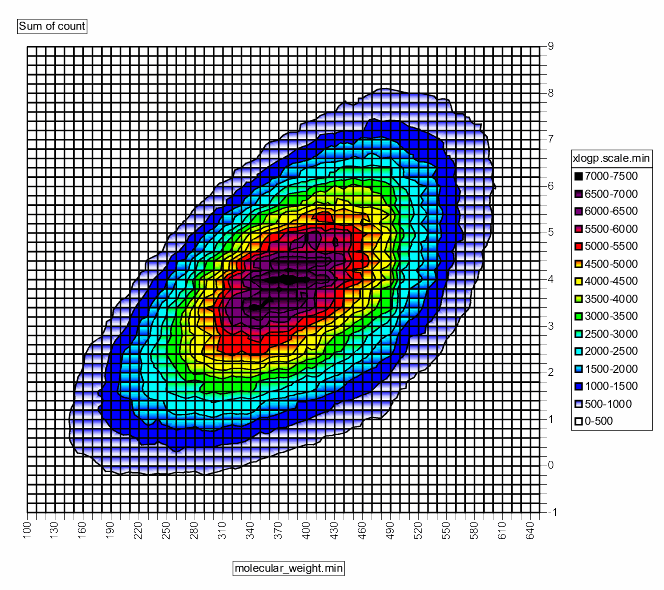
Two-dimensional histogram of the chemicals with respect to molecular weight and calculated XLogP value, an estimate of the chemical's water / oil partition coefficient often used to approximate a chemical's solubility and thus permeability through phospholipid, biological membranes. The diagonal shape indicates a positive correlation between these two properties, but the broad shape indicates a weak relationship.
